PROXIMANOVA-LIGHT.OTF PROXIMANOVA-LIGHTIT.OTF PROXIMANOVA-EXTRABLD.OTF PROXIMANOVA-BOLD.OTFPROXIMANOVA-BLACK.OTF
Get this font in here!
This Article Applies to:
- AVG Business Cloud Console
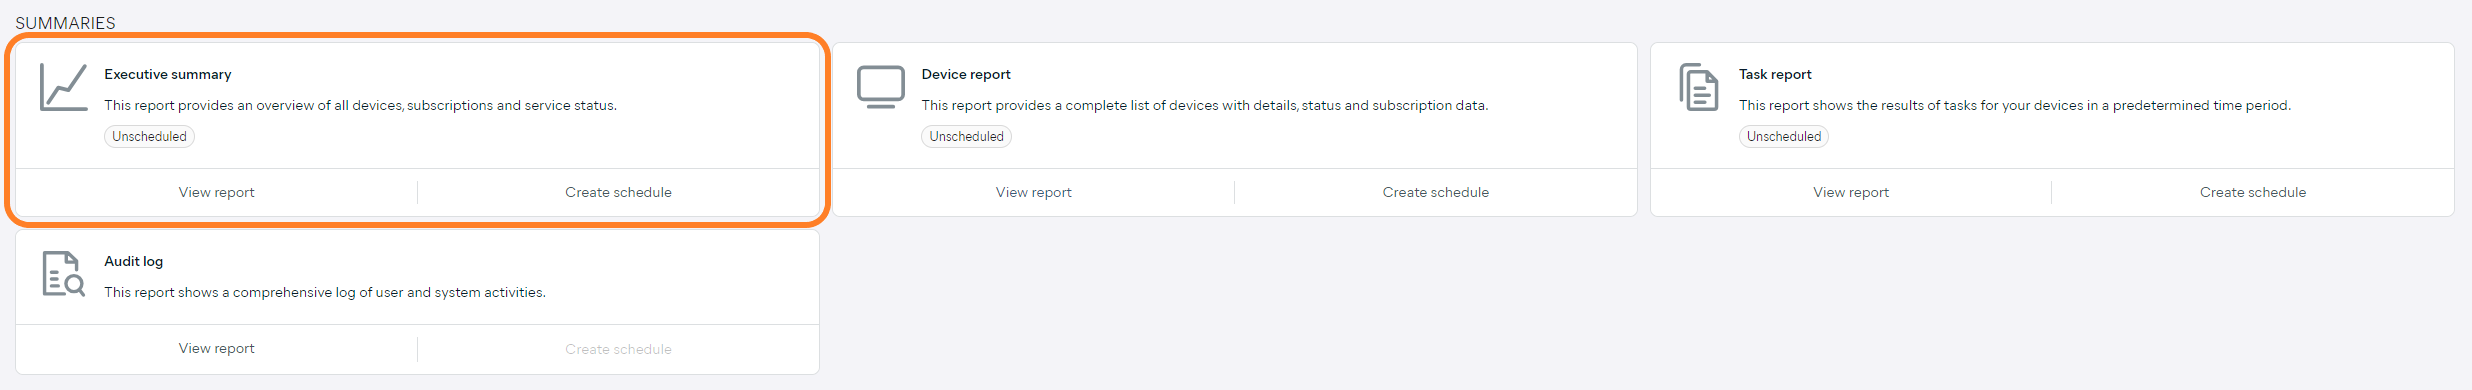
The Executive Summary report provides overview of all devices and their statuses and threats, as well as at-a-glance values for threats, patches, and devices.
The report can be accessed and scheduled from the Summaries section of the Reports page.
Report Details
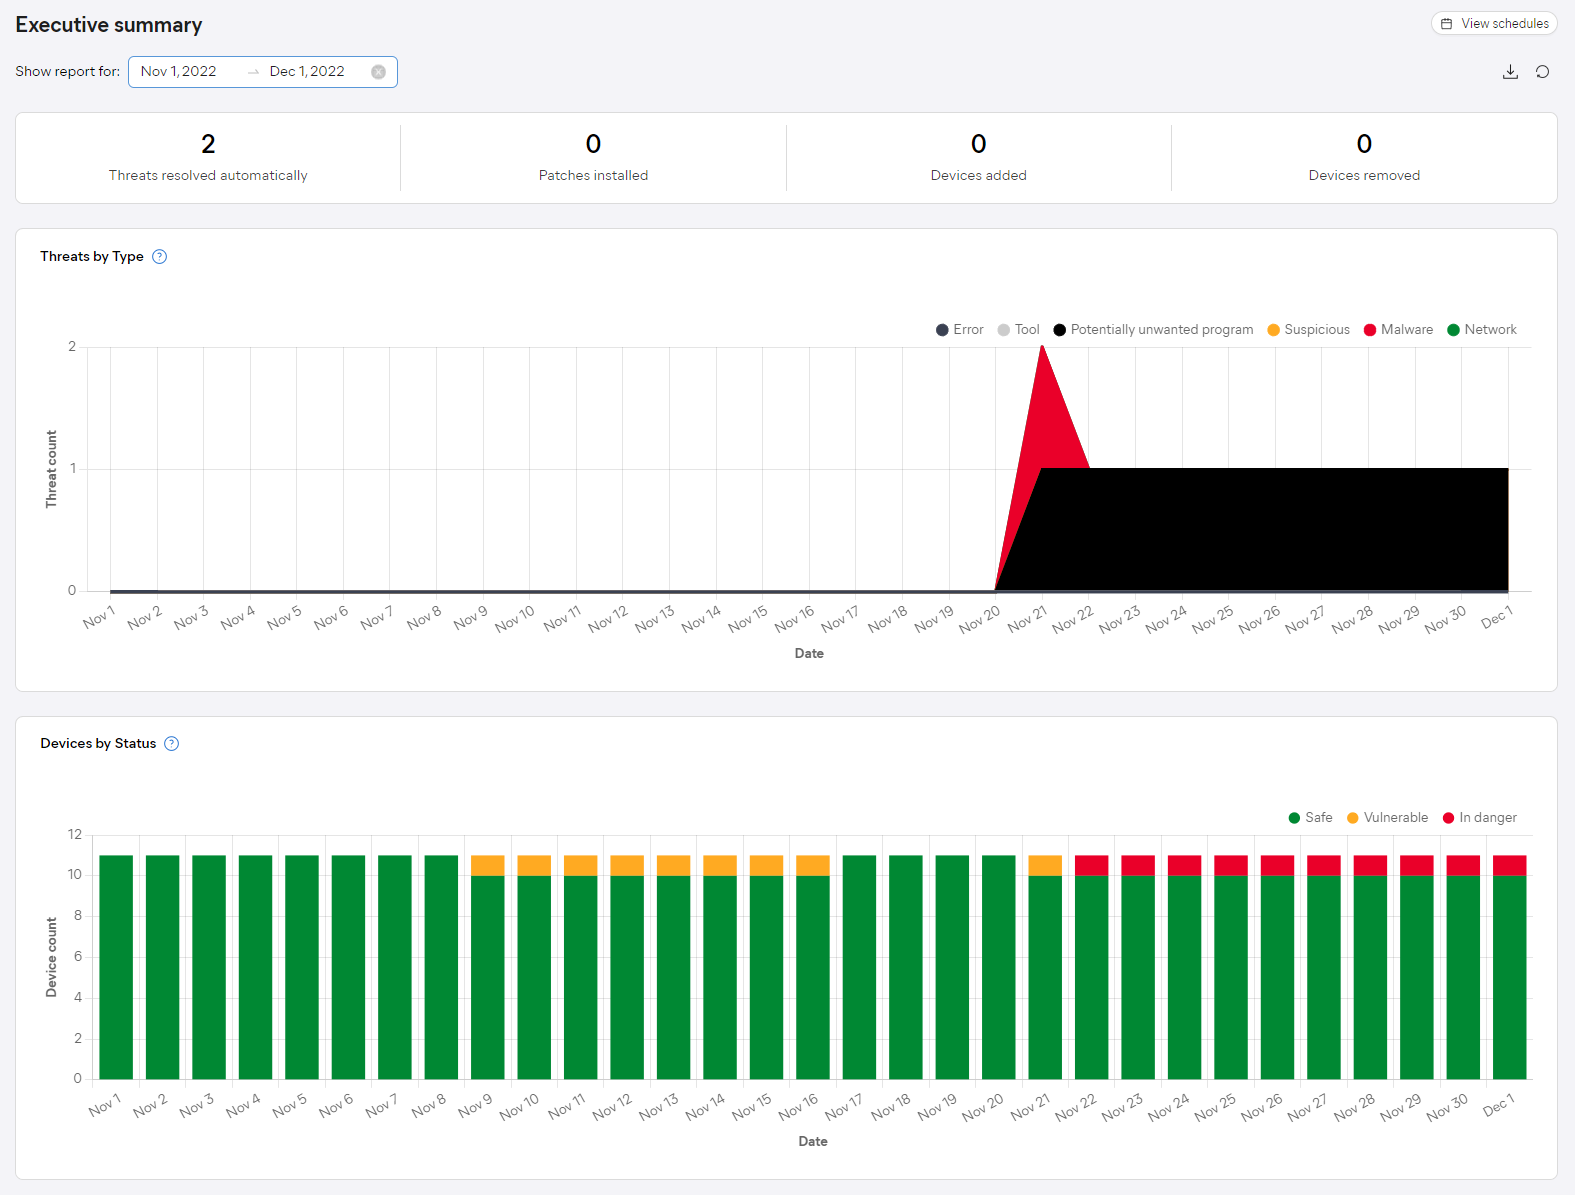
The report will display two charts:
- Threats by type — Shows all threats detected within a specified time frame in a line chart, with each type of threat as a unique line and color. The threats are categorized as follows:
- Error
- Tool
- Potentially unwanted program
- Suspicious
- Malware
- Network
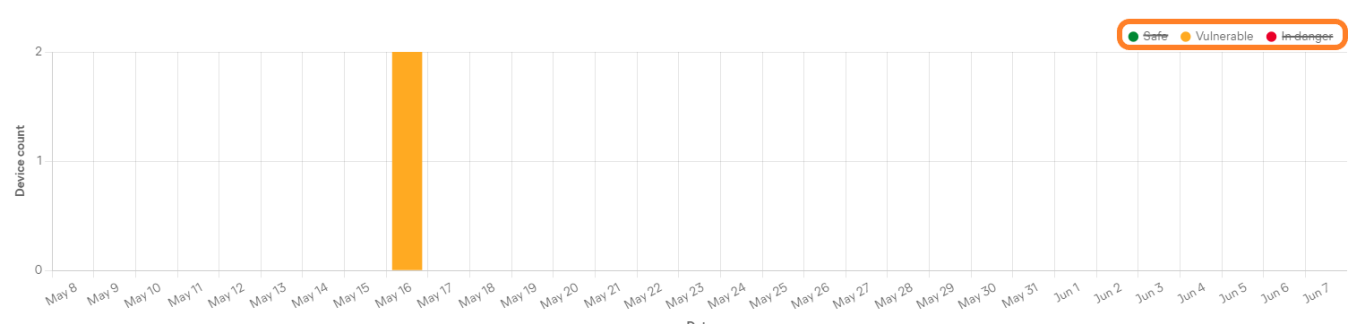
- Devices by status — Shows devices' statuses in a bar chart, with each bar showing the proportion of safe, vulnerable, and devices in danger during the specified time frame.
The counter above the charts will show the number of automatically resolved threats, installed patches, and added and removed devices within the specified time frame.
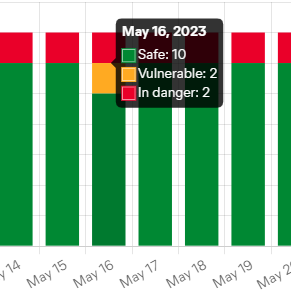
Hovering over any of the two charts will display the exact data for specific dates.
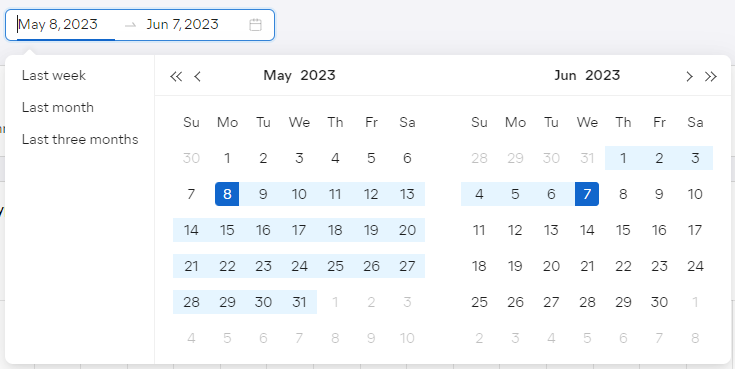
By default, the report will display information for the last 30 days. You can adjust the time frame by clicking the start or the end date and then choosing different dates from the calendar, or by selecting one of the quick options on the left (Last week, Last month, Last three months).
To facilitate data lookup further, the Executive Summary charts can be customized by clicking the keys above them to exclude related results.
Scheduling and Exporting
You can set up your reports to be automatically generated on a recurring basis, then emailed to specified users. You can also manually download them in
For instructions, see