PROXIMANOVA-LIGHT.OTF PROXIMANOVA-LIGHTIT.OTF PROXIMANOVA-EXTRABLD.OTF PROXIMANOVA-BOLD.OTFPROXIMANOVA-BLACK.OTF
Get this font in here!
This Article Applies to:
- AVG Business Cloud Console
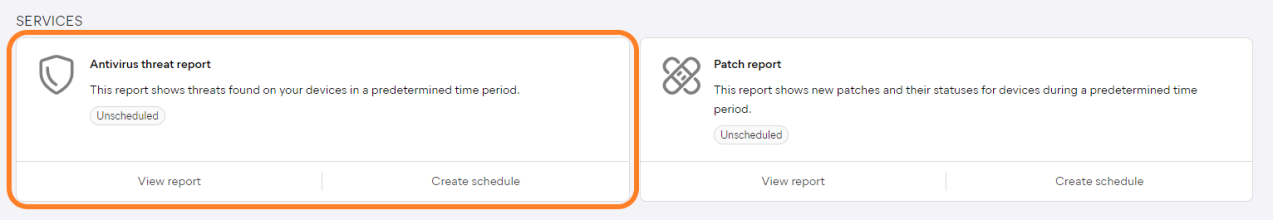
The Antivirus threat report provides information on threats found on your devices within a defined time frame. It can be accessed and scheduled from the Services section of the Reports page.
Report Details
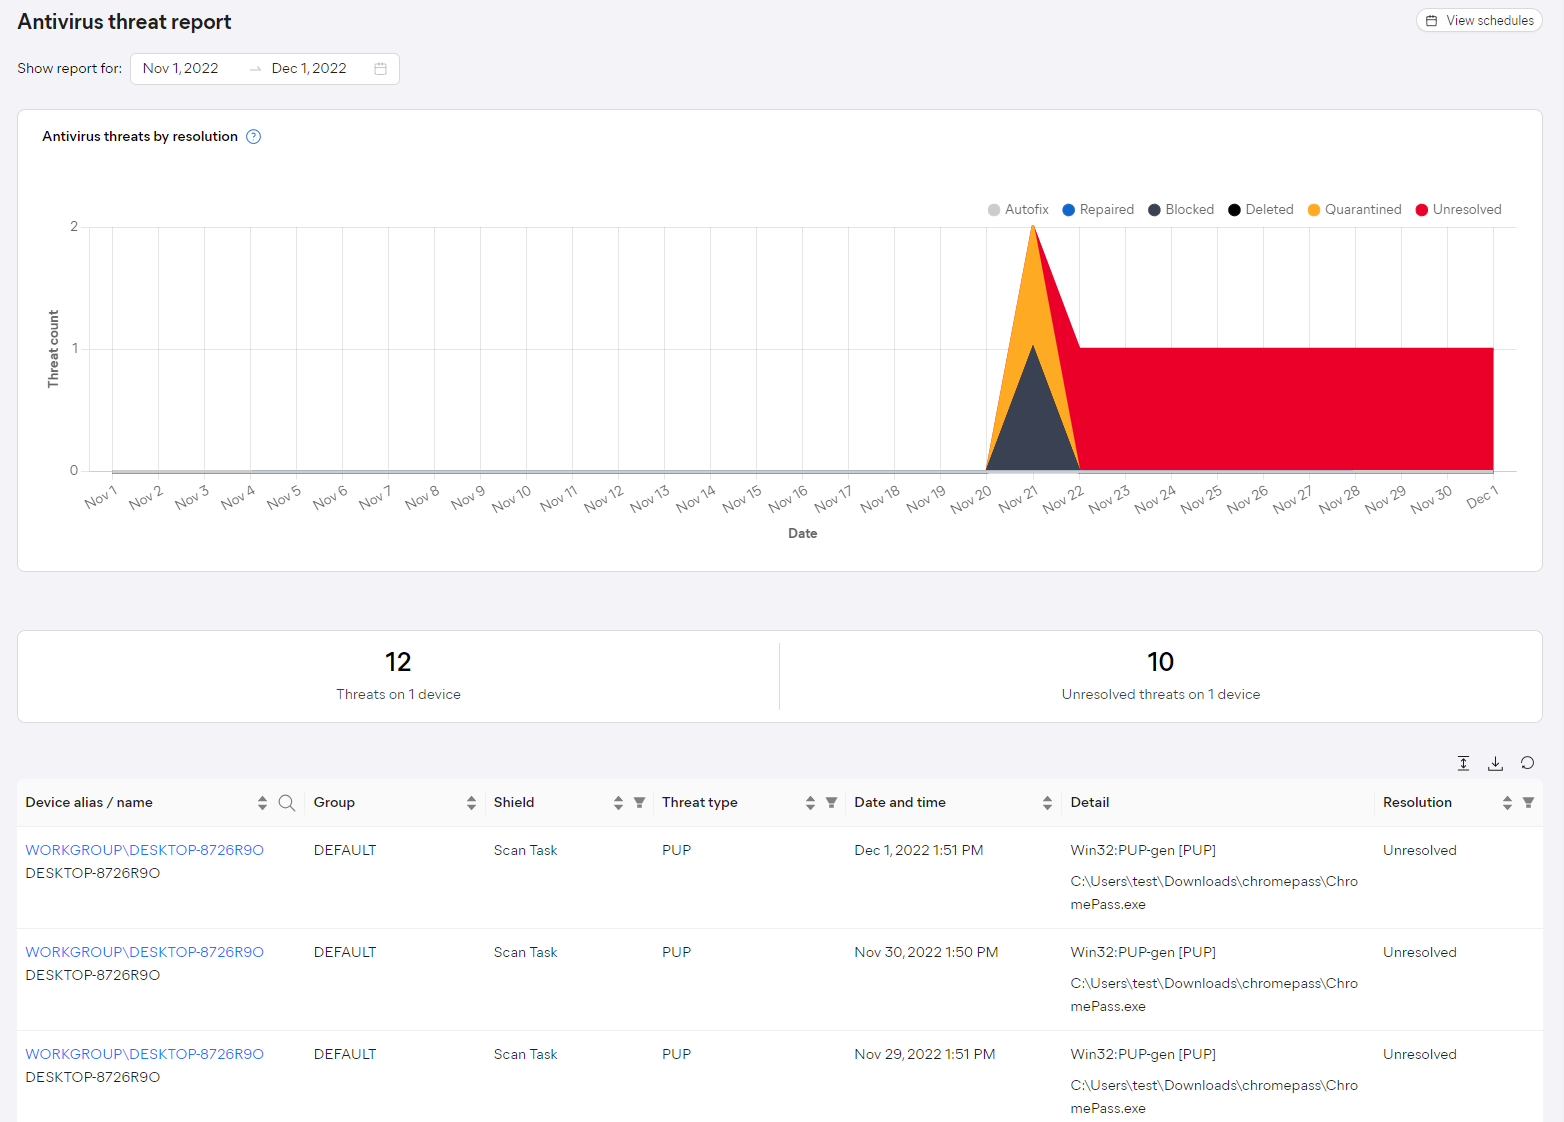
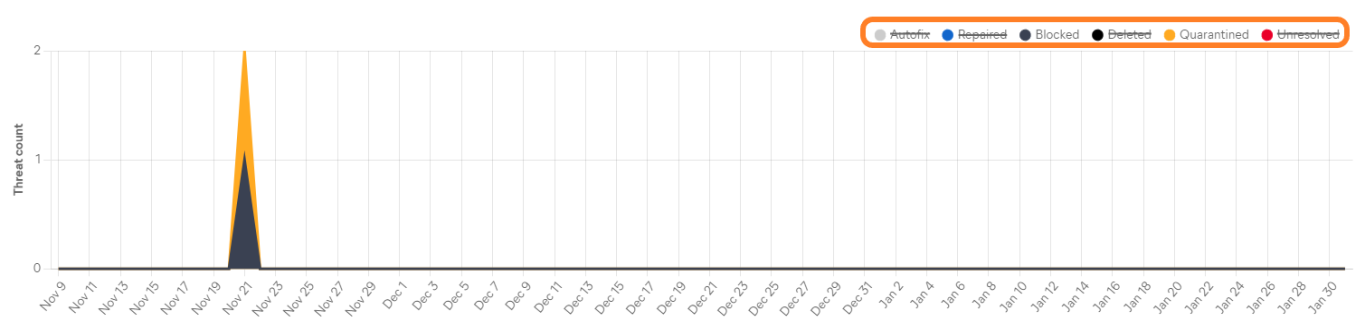
At the top of the page, you will see a line chart showing all threats detected during a specified time frame. The threats are categorized by resolution:
- Autofix: Antivirus followed an automated process to deal with the threat by trying to repair, quarantine, and/or delete it (as configured in policies)
- Repaired: The threat was repaired (e.g. bad code removed from a file)
- Blocked: The threat was blocked (e.g. connection aborted by Web Shield)
- Deleted: The threat was deleted from the device
- Quarantined: The threat was detected and moved to Quarantine
- Unresolved: The threat was detected, but further action is needed to deal with it
The counter below the chart will show the total number of detected threats (and affected devices) and of unresolved threats (and affected devices) within the specified time frame.
The list at the bottom will display more detailed information about threats detected on your devices during the defined time frame. For each listed device, you can see the following information:
- Device alias/name (clicking an alias link will redirect you to the AV Threats tab of the device's Detail drawer)
- Group
- Shield that detected the threat
- Threat type
- Date and time of detection
- Detail (threat location path/URL)
- Resolution type
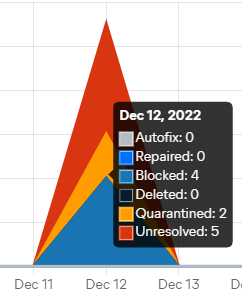
Hovering over the chart will display the exact data for specific dates.
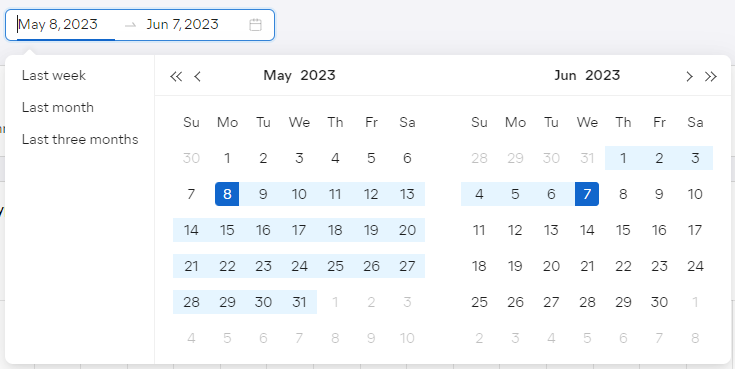
By default, the report will display information for the last 30 days. You can adjust the time frame by clicking the start or the end date and then choosing different dates from the calendar, or by selecting one of the quick options on the left (Last week, Last month, Last three months).
To facilitate data lookup, the chart can be customized by clicking the keys above it to exclude related results.
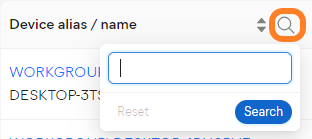
Furthermore, you can use the search option to search by device alias/name.
You can also filter the report by:
- Shield: Scan task, Mail Shield, File Shield, Web Shield, Script Shield, Behavior Shield, Exchange Shield, SharePoint Shield, Firewall, Remote Access Shield
- Threat type: Error, PUP, Suspicious, Malware, Tool, Network
- Resolution: Quarantined, Deleted, Repaired, Autofix, Unresolved, Blocked
Multiple columns can be sorted to display the results in ascending or descending order.
Scheduling and Exporting
You can set up your reports to be automatically generated on a recurring basis, then emailed to specified users. You can also manually download them in
For instructions, see